Tornado Chart Generator
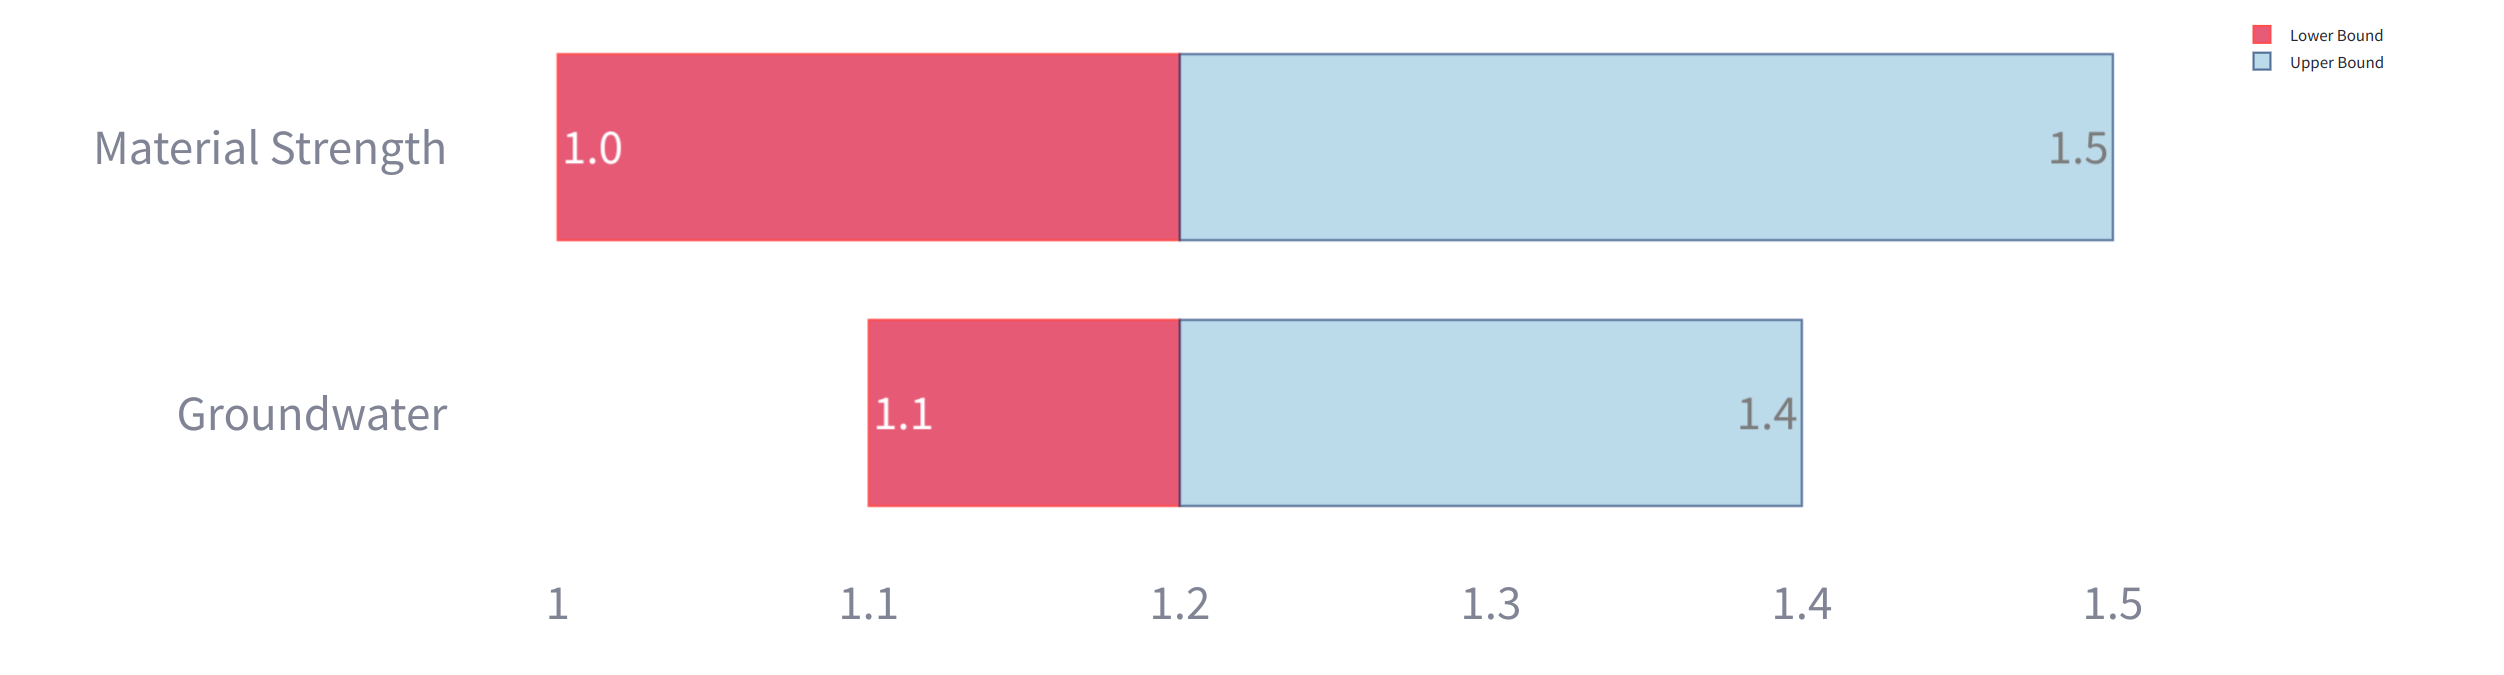
Tornado chart is an effective method to visualise the impact of uncertainties.
Inputs
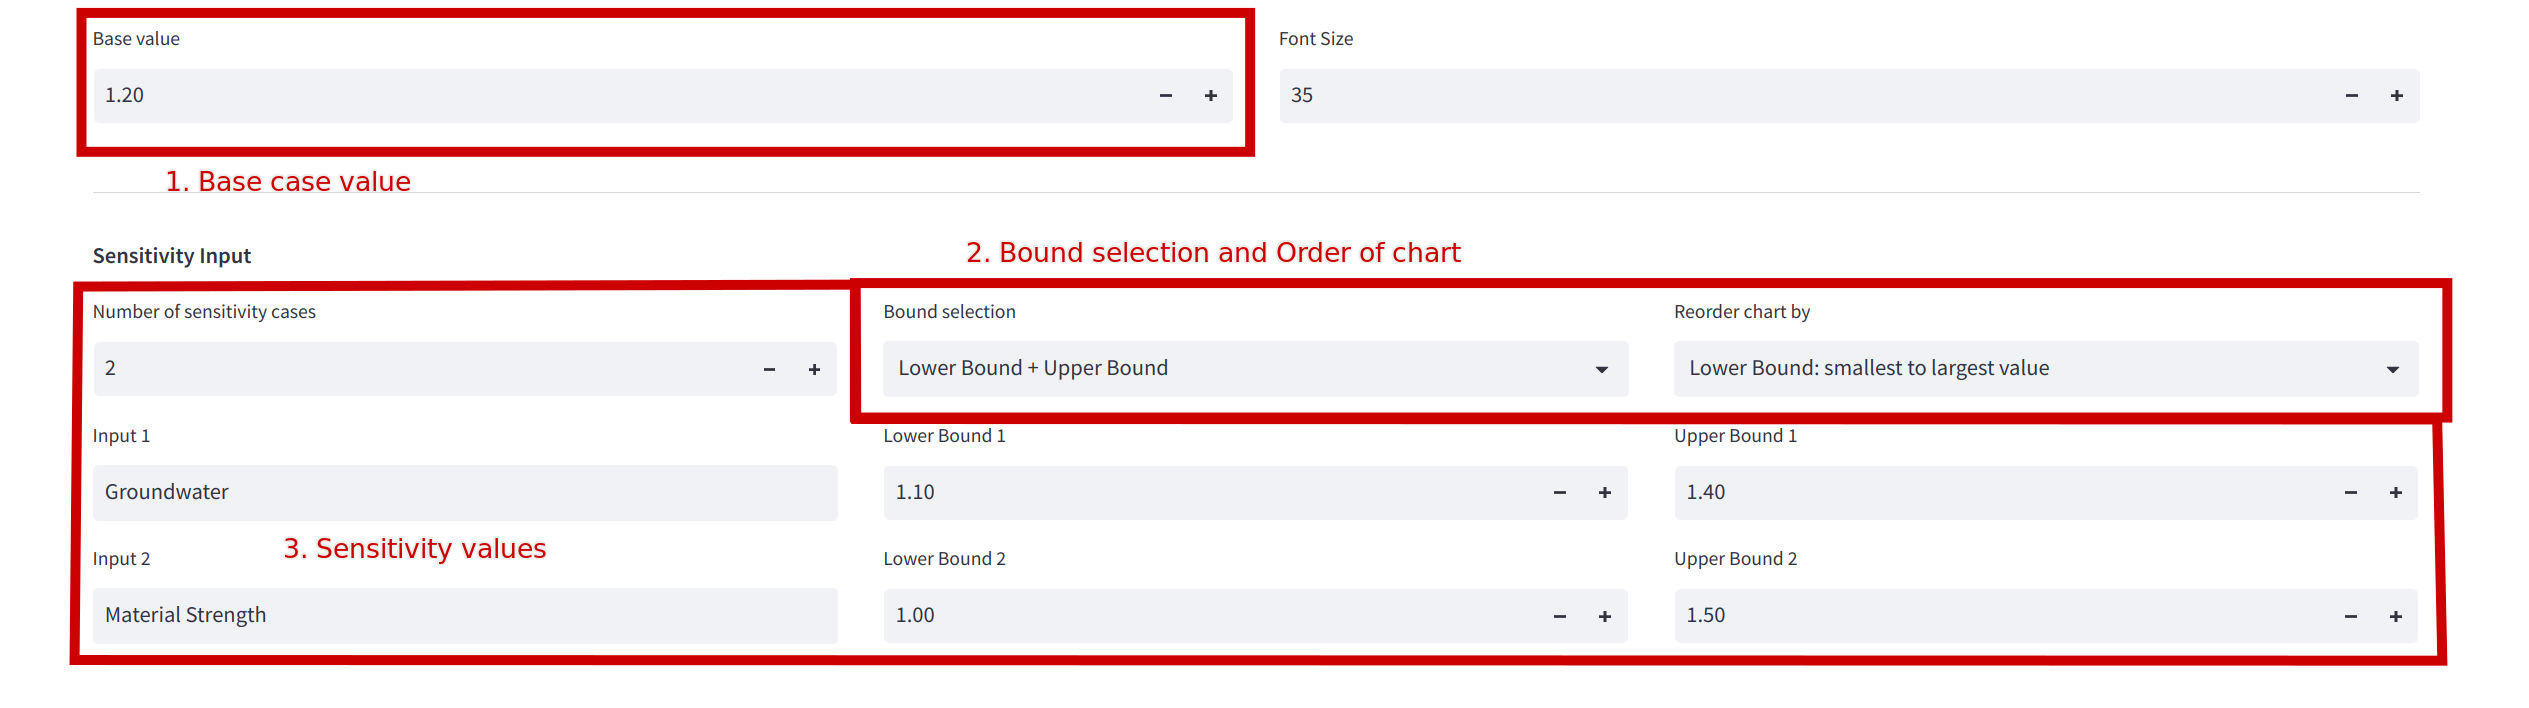
Base case value and lower bound and/or values are the main inputs for a tornado chart.
Outputs
Outputs allow clients to visualise the most influencing factor of Geotechnical assessments and make it easier to decide what controls need to be in place.